Joel Greenblatt’s The Little Book That Still Beats the Market showed that a simple strategy — ranking stocks by return on capital and earnings yield — delivered ~30% annual returns over a long period.
I wanted to see if that holds up. And if so, how could we improve it?
So I built a backtesting engine from scratch.
Not just the formula — the full pipeline:
- point-in-time fundamentals
- universe construction
- ranking + portfolio logic
- config driven execution (with assumptions)
- tax, costs, and cash flows
What was surprising was how little the formula itself mattered compared to everything around it.
The strategy is simple. The system isn’t.
The Magic Formula sounds trivial:
- Rank stocks by return on capital (ROC)
- Rank stocks by earnings yield (EY)
- Combine ranks and buy the best of both
- Hold for a year, then sell
- Repeat steps 1-4
But implementing it properly required decisions everywhere:
- When does fundamental data become available?
- Do you use a filing date or period date?
- How do you handle missing or stale data?
- What counts as financials or utilities companies (to be excluded)?
- What do you do with extreme values (unlikely EY or ROC amounts)?
- How do you construct enterprise value consistently?
These aren’t technical footnotes.
They define the result.
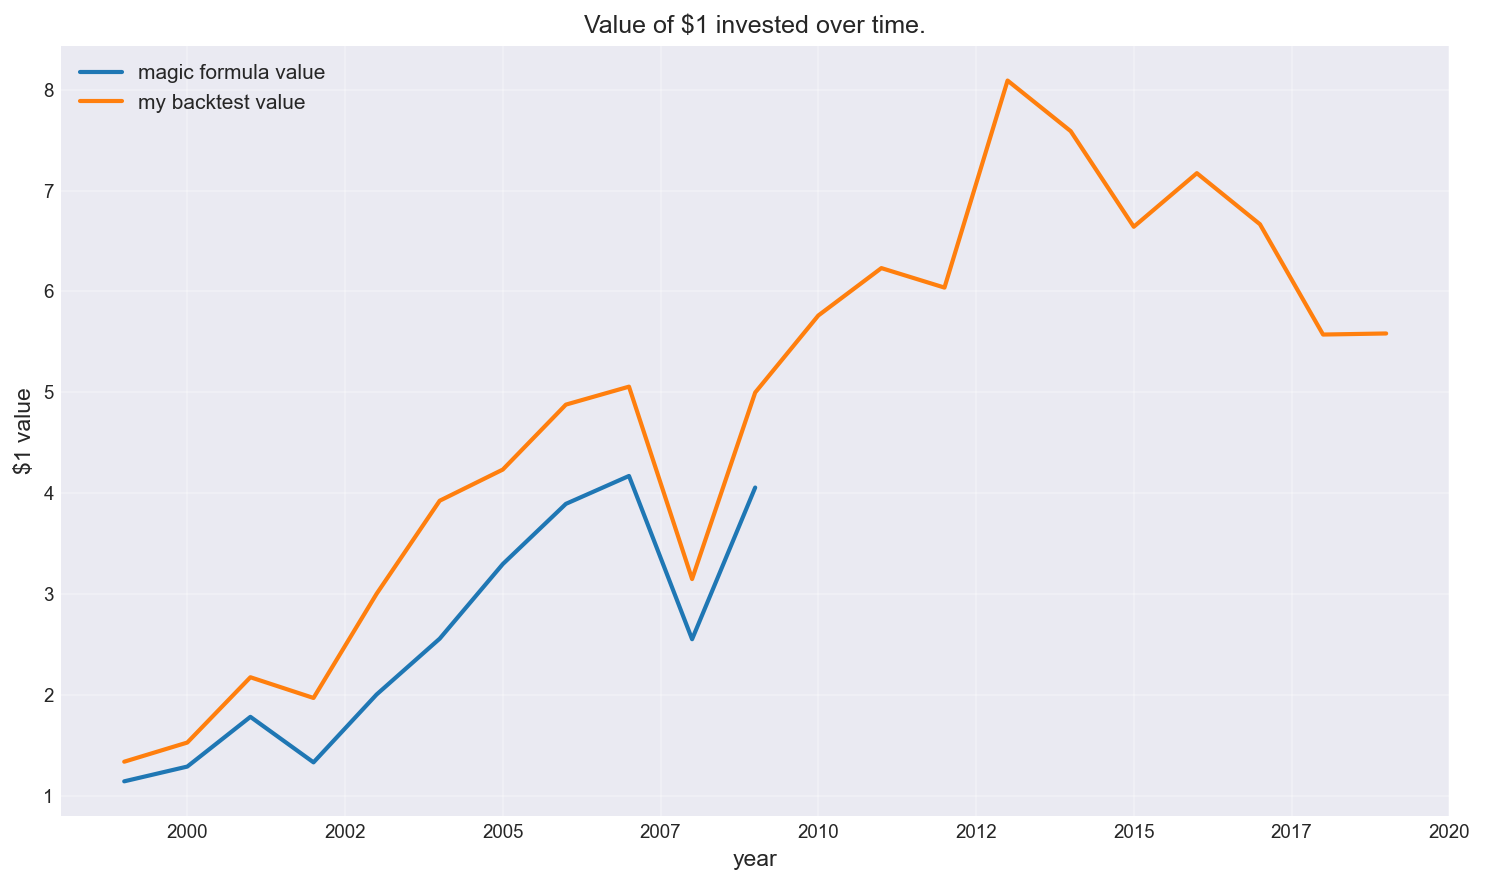
First: can you actually reproduce the original result?
Before testing variations, the first goal was simple:
Can I replicate something close to the original Magic Formula performance?
That required:
- building a clean NYSE/NASDAQ universe
- aligning fundamentals using filing dates (point-in-time)
- constructing ROC and EY consistently
- applying realistic portfolio rules with real world constraints (and assumptions)
As shown below, the result (orange) was broadly in line with expectations (blue) — not exact, but directionally consistent.
Growth of $1 invested
Annual returns comparison
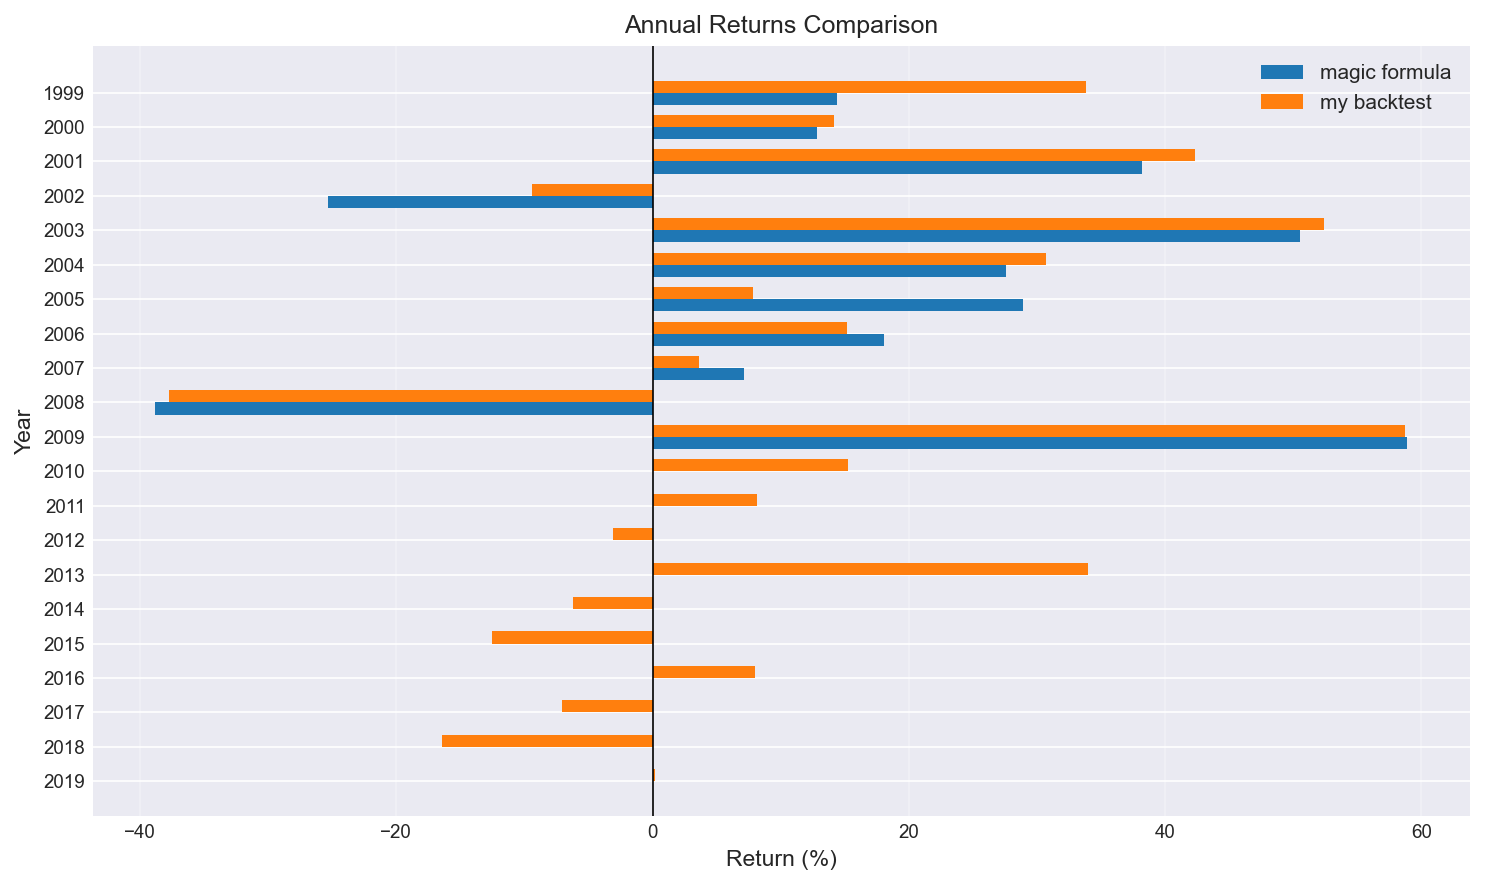
This step was important because without it, any “improvement” we find later is meaningless. It also shows that since 2009 (beyond the Magic formula cut-off) performance has been far less impressive.
The magic formula (default) assumes (amongst others):
- Buy 5 stocks every 2 months until we reach 30 stocks
- Hold for 1 year before selling
- Brokerage fee $20 (adjusted)
- Slippage 1%
- Force sell stock (when required)
Data engineering and algorithm config is the strategy
I used Sharadar (Quandl) point-in-time end-of-day fundamentals data across NYSE/NASDAQ.
The biggest risks weren’t bugs — they were subtle:
- Lookahead bias from using period-end data instead of filing dates
- Stale fundamentals being reused too aggressively
- Broken joins between price and fundamentals
- Outliers (e.g. extreme ROC/EY) distorting rankings
- Config (e.g. minimum market capitalisation, ramp-up strategy, brokerage/slippage fees)
To keep the backtest honest:
- fundamentals only entered the system after filing date
- values were forward-filled conservatively
- exclusions were logged, not silently dropped
- annual data was preferred over quarterly to reduce noise
This is where many naive backtests can go wrong.
What actually moved the results
Once the system was working, I expected the main question to be:
“Does the Magic Formula still work?”
It wasn’t.
The real question became:
“Which implementation choices actually drive the outcome?”
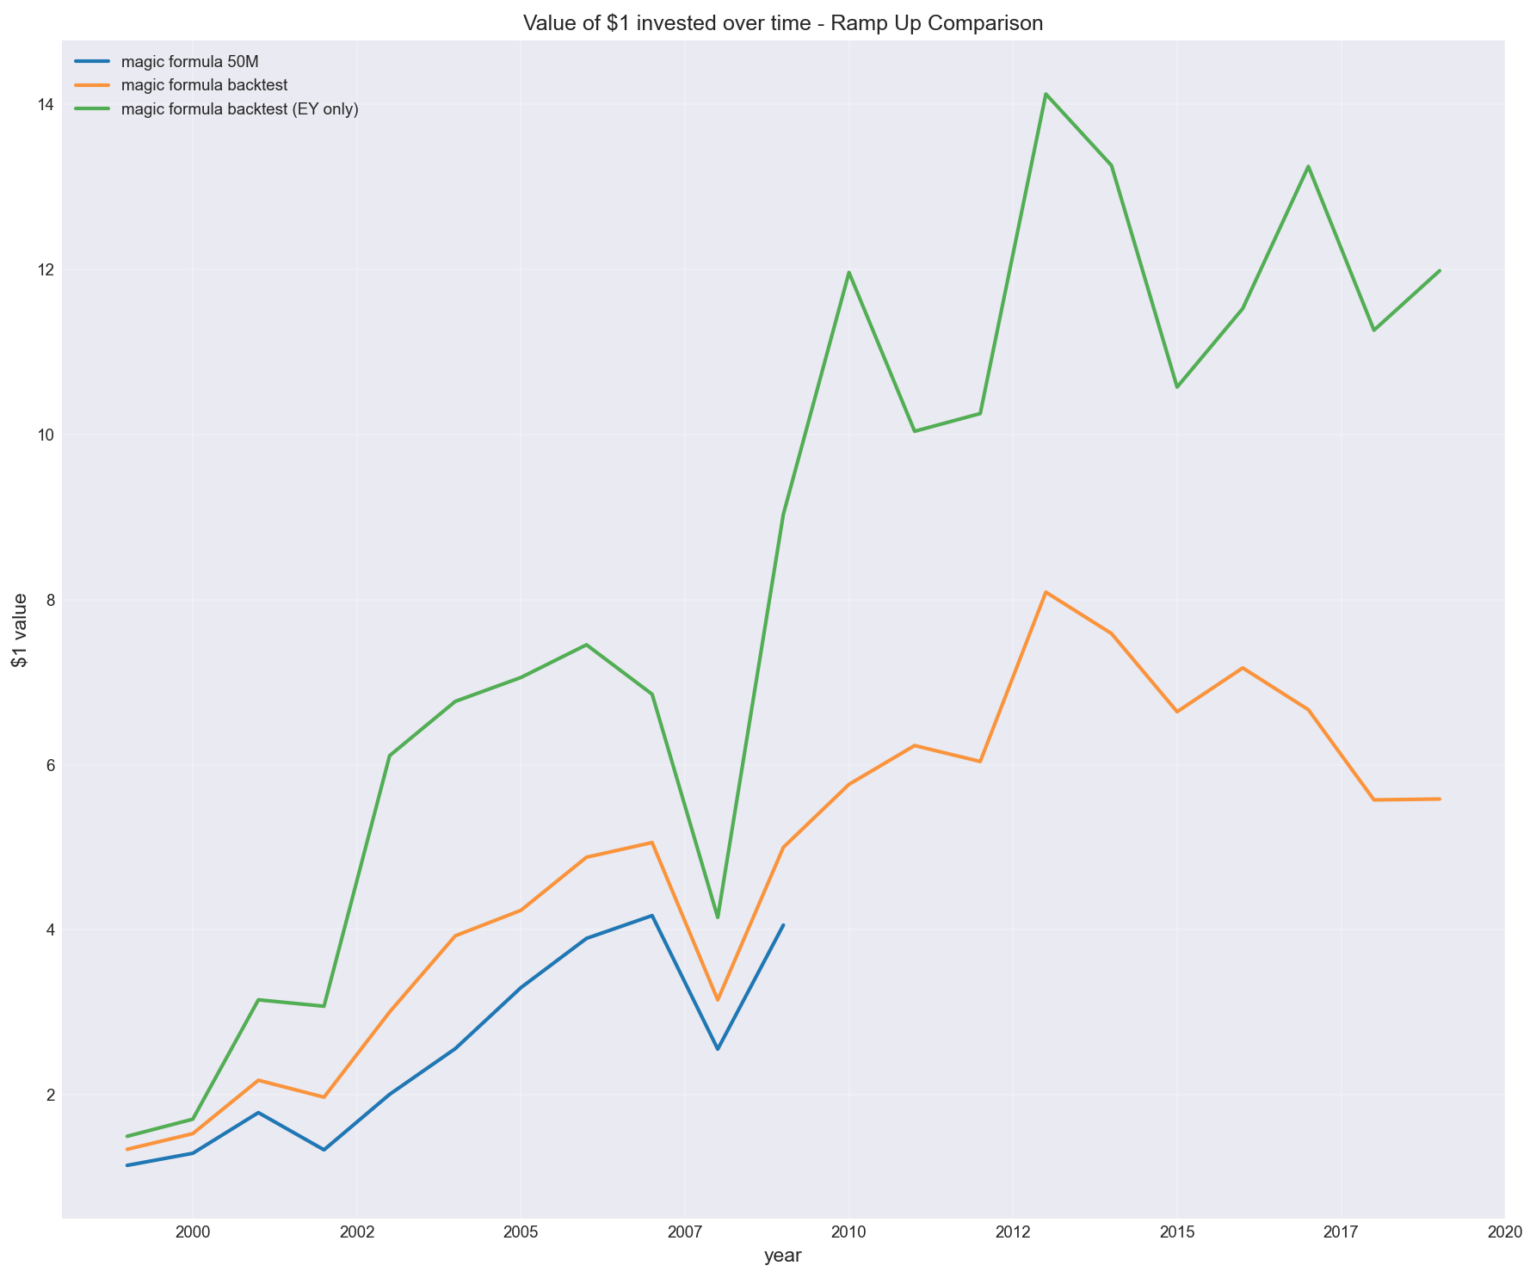
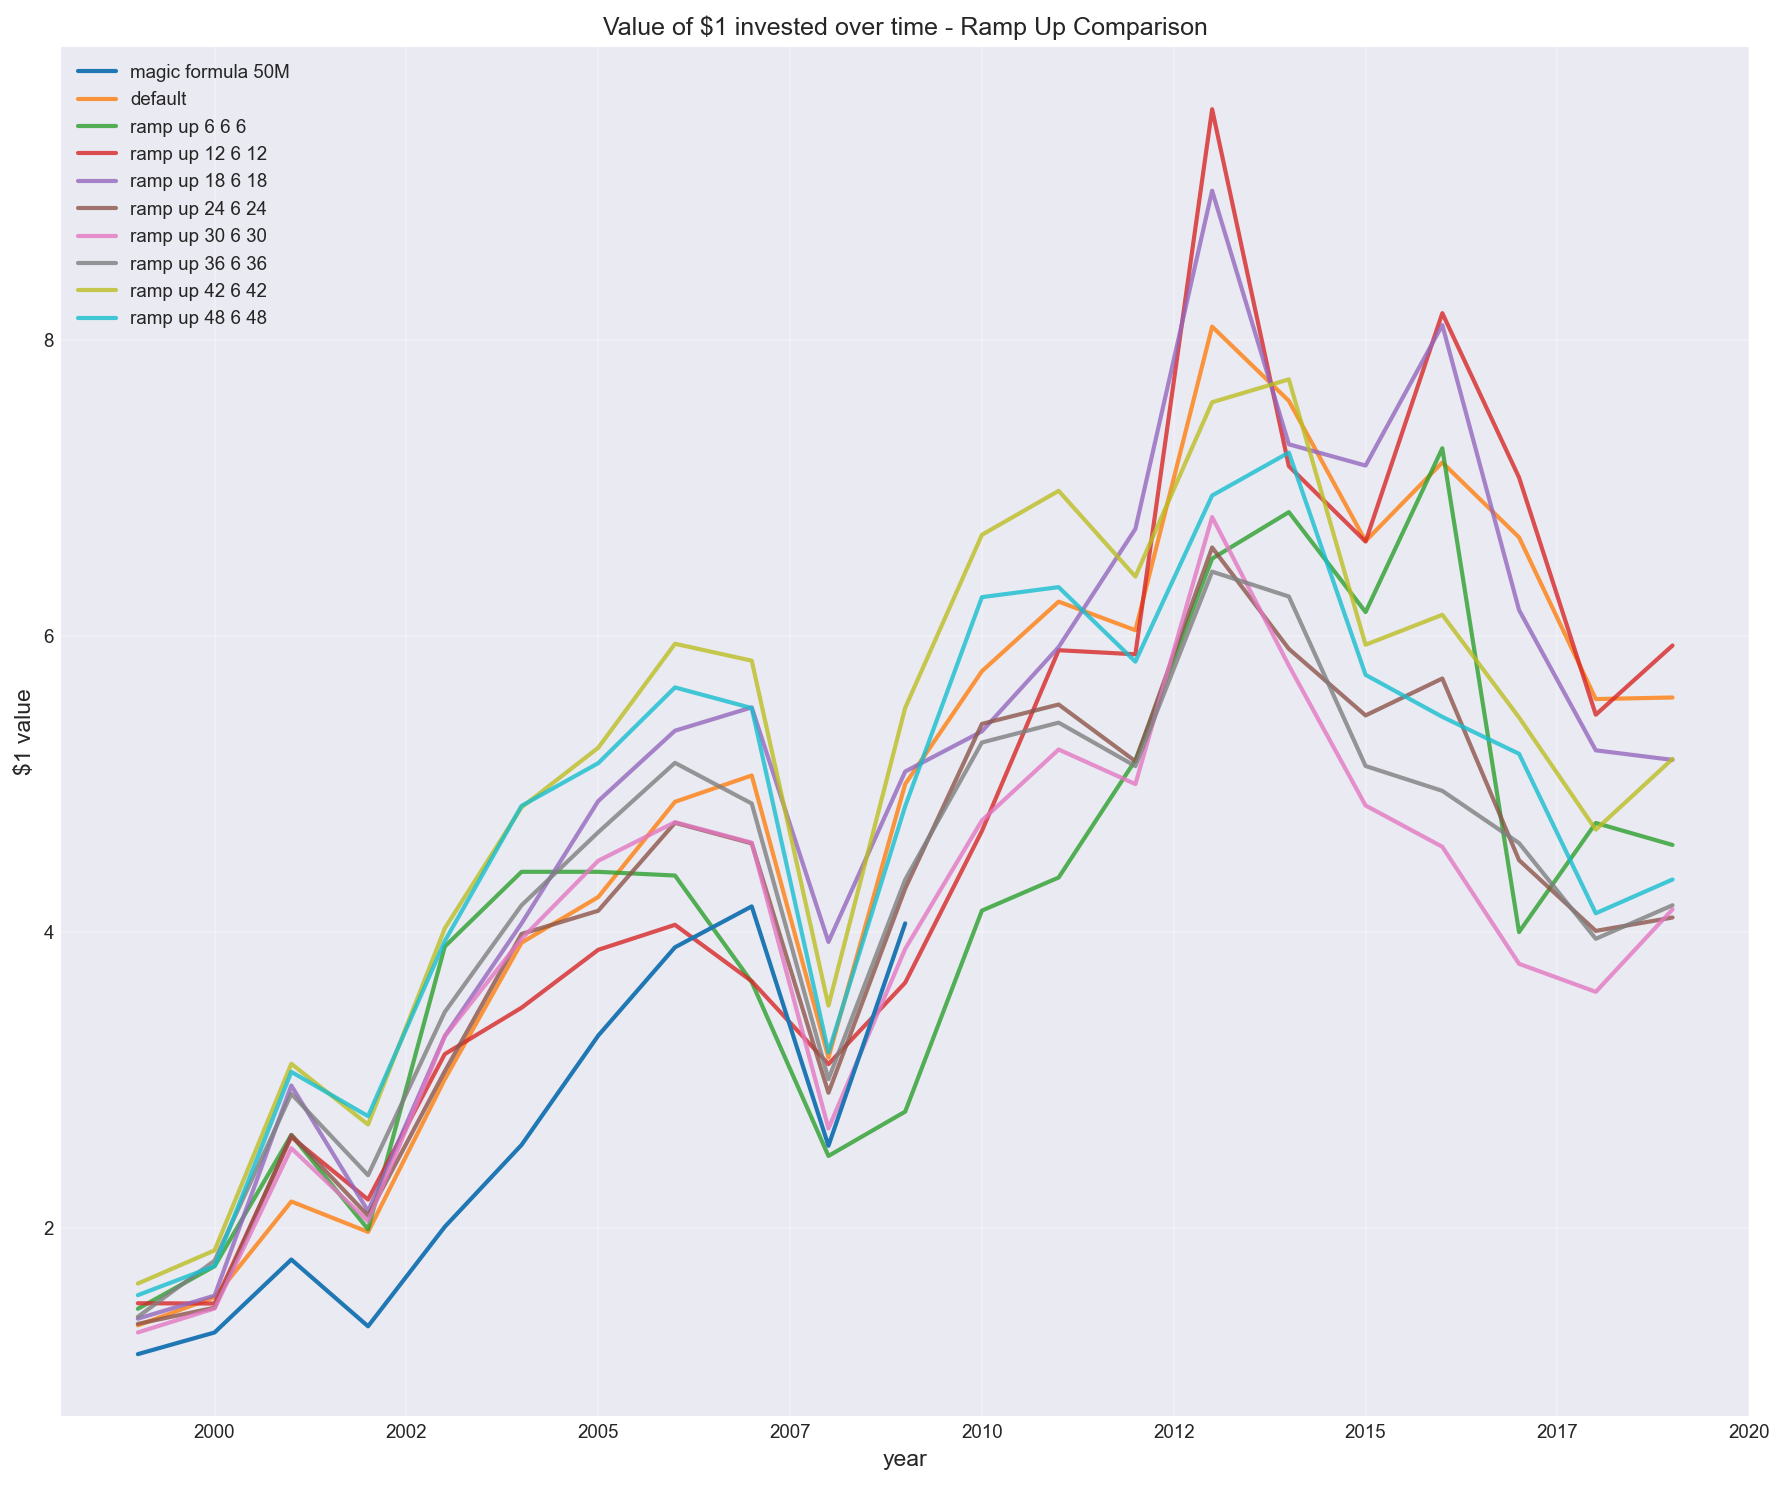
1. Portfolio construction (ramp-up strategy and total stocks)
Greenblatt suggests building a portfolio over time, but doesn’t define how.
I tested different ramp-up approaches.
For the purpose of creating a baseline backtest, I assume the default to be – buying 5 stocks every 2 months. However, how would the result differ if we stopped at a 20 stock portfolio instead of 30?
Or what about other portfolio sizes?
The result wasn’t marginal.
It created a wide dispersion in outcomes, with some configurations materially outperforming others.
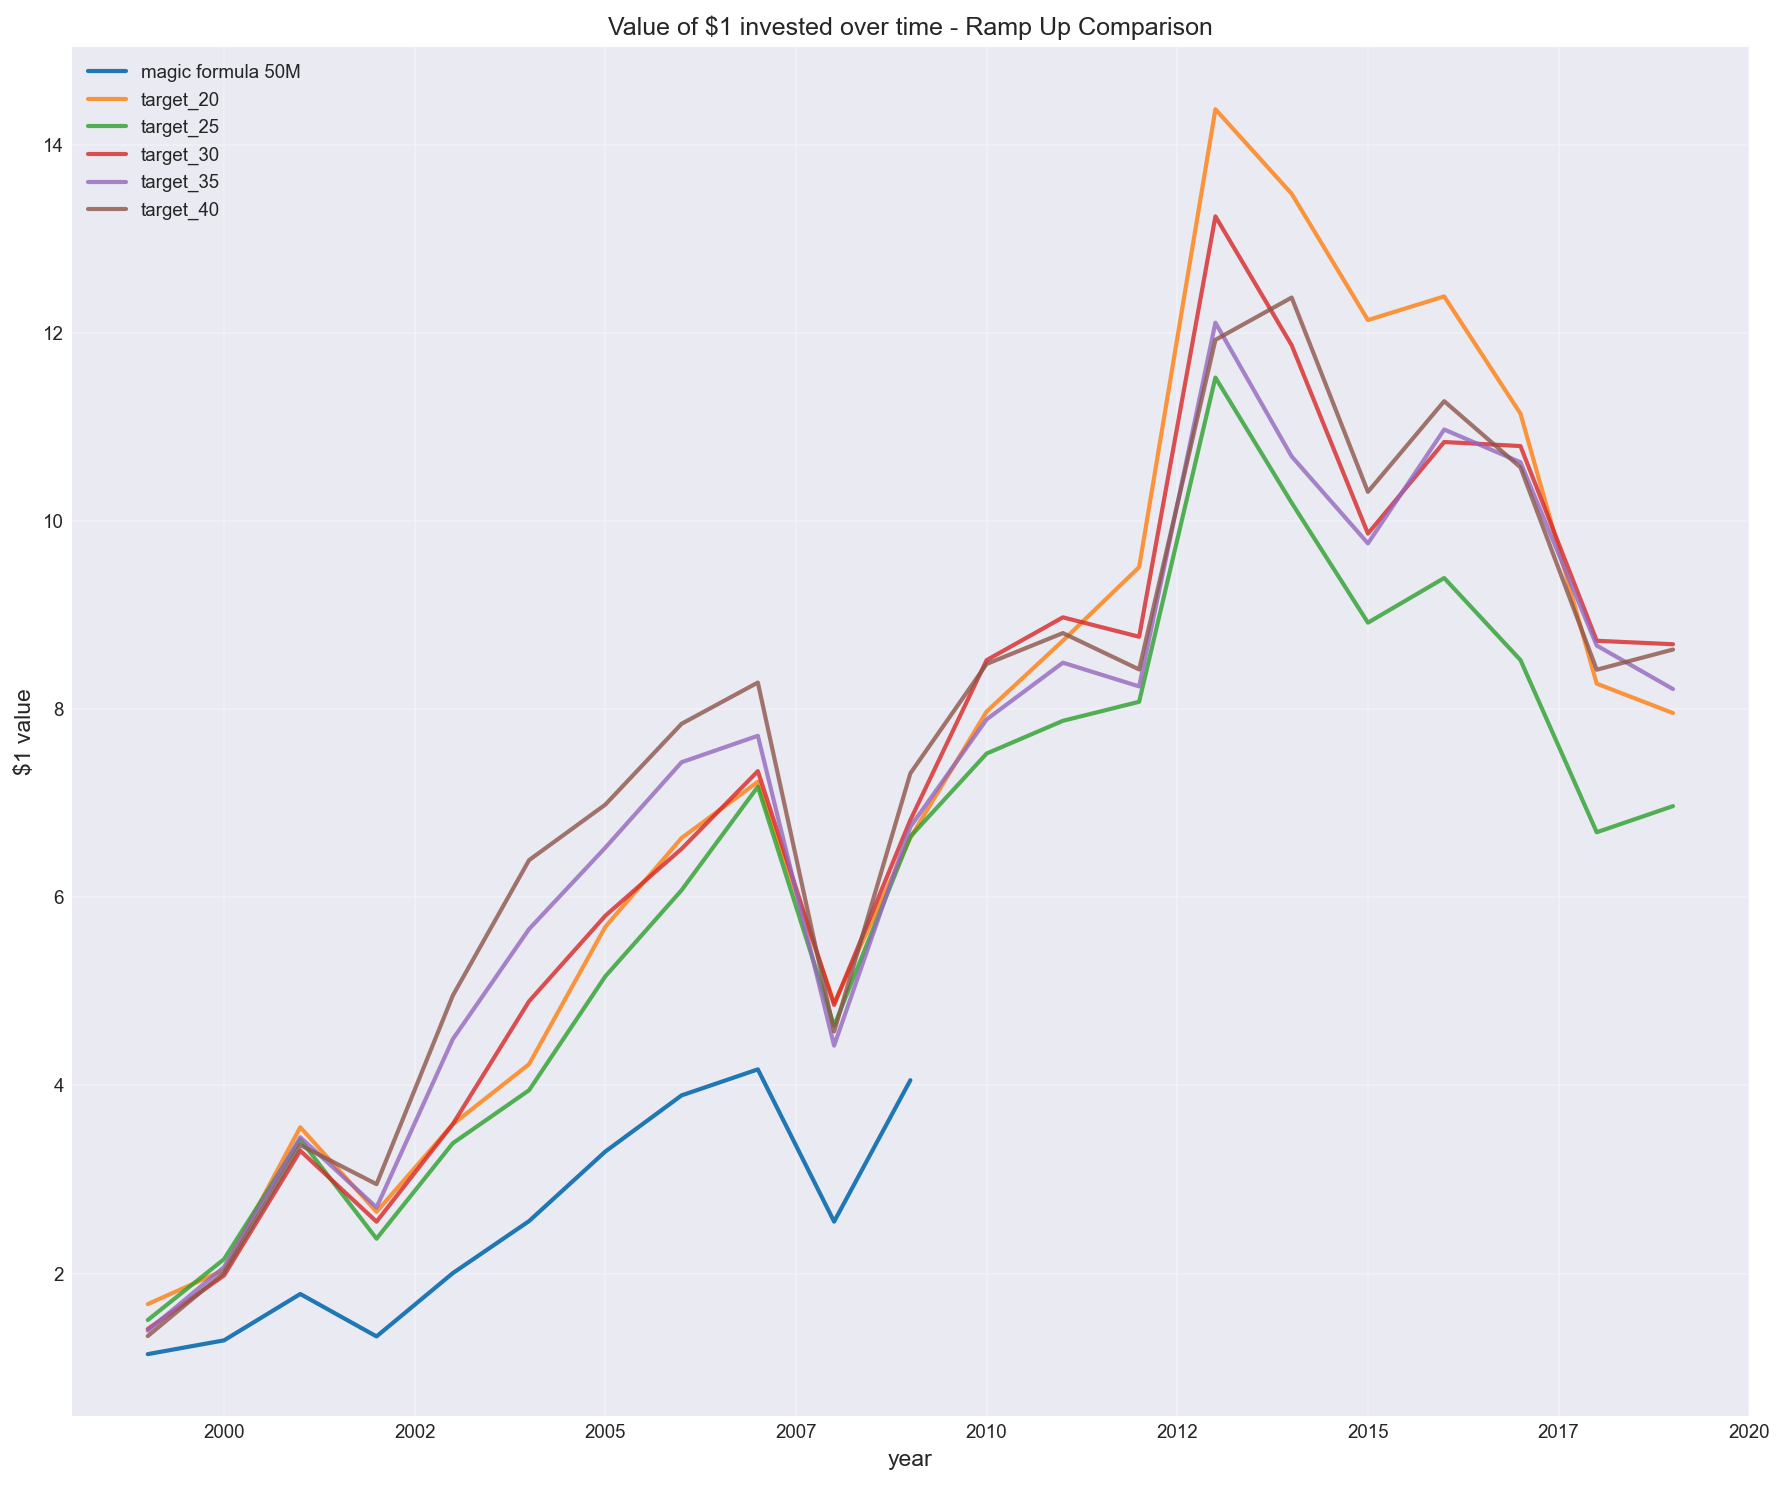
Buying 5 stocks every 2 months to reach different target portfolio sizes
This wasn’t about the signal.
It was about how the portfolio was constructed.
(Note in chart above: “target_30” is backtested magic formula, whereas “magic formula 50M” is returns stated from Joel Greenblatt’s results)
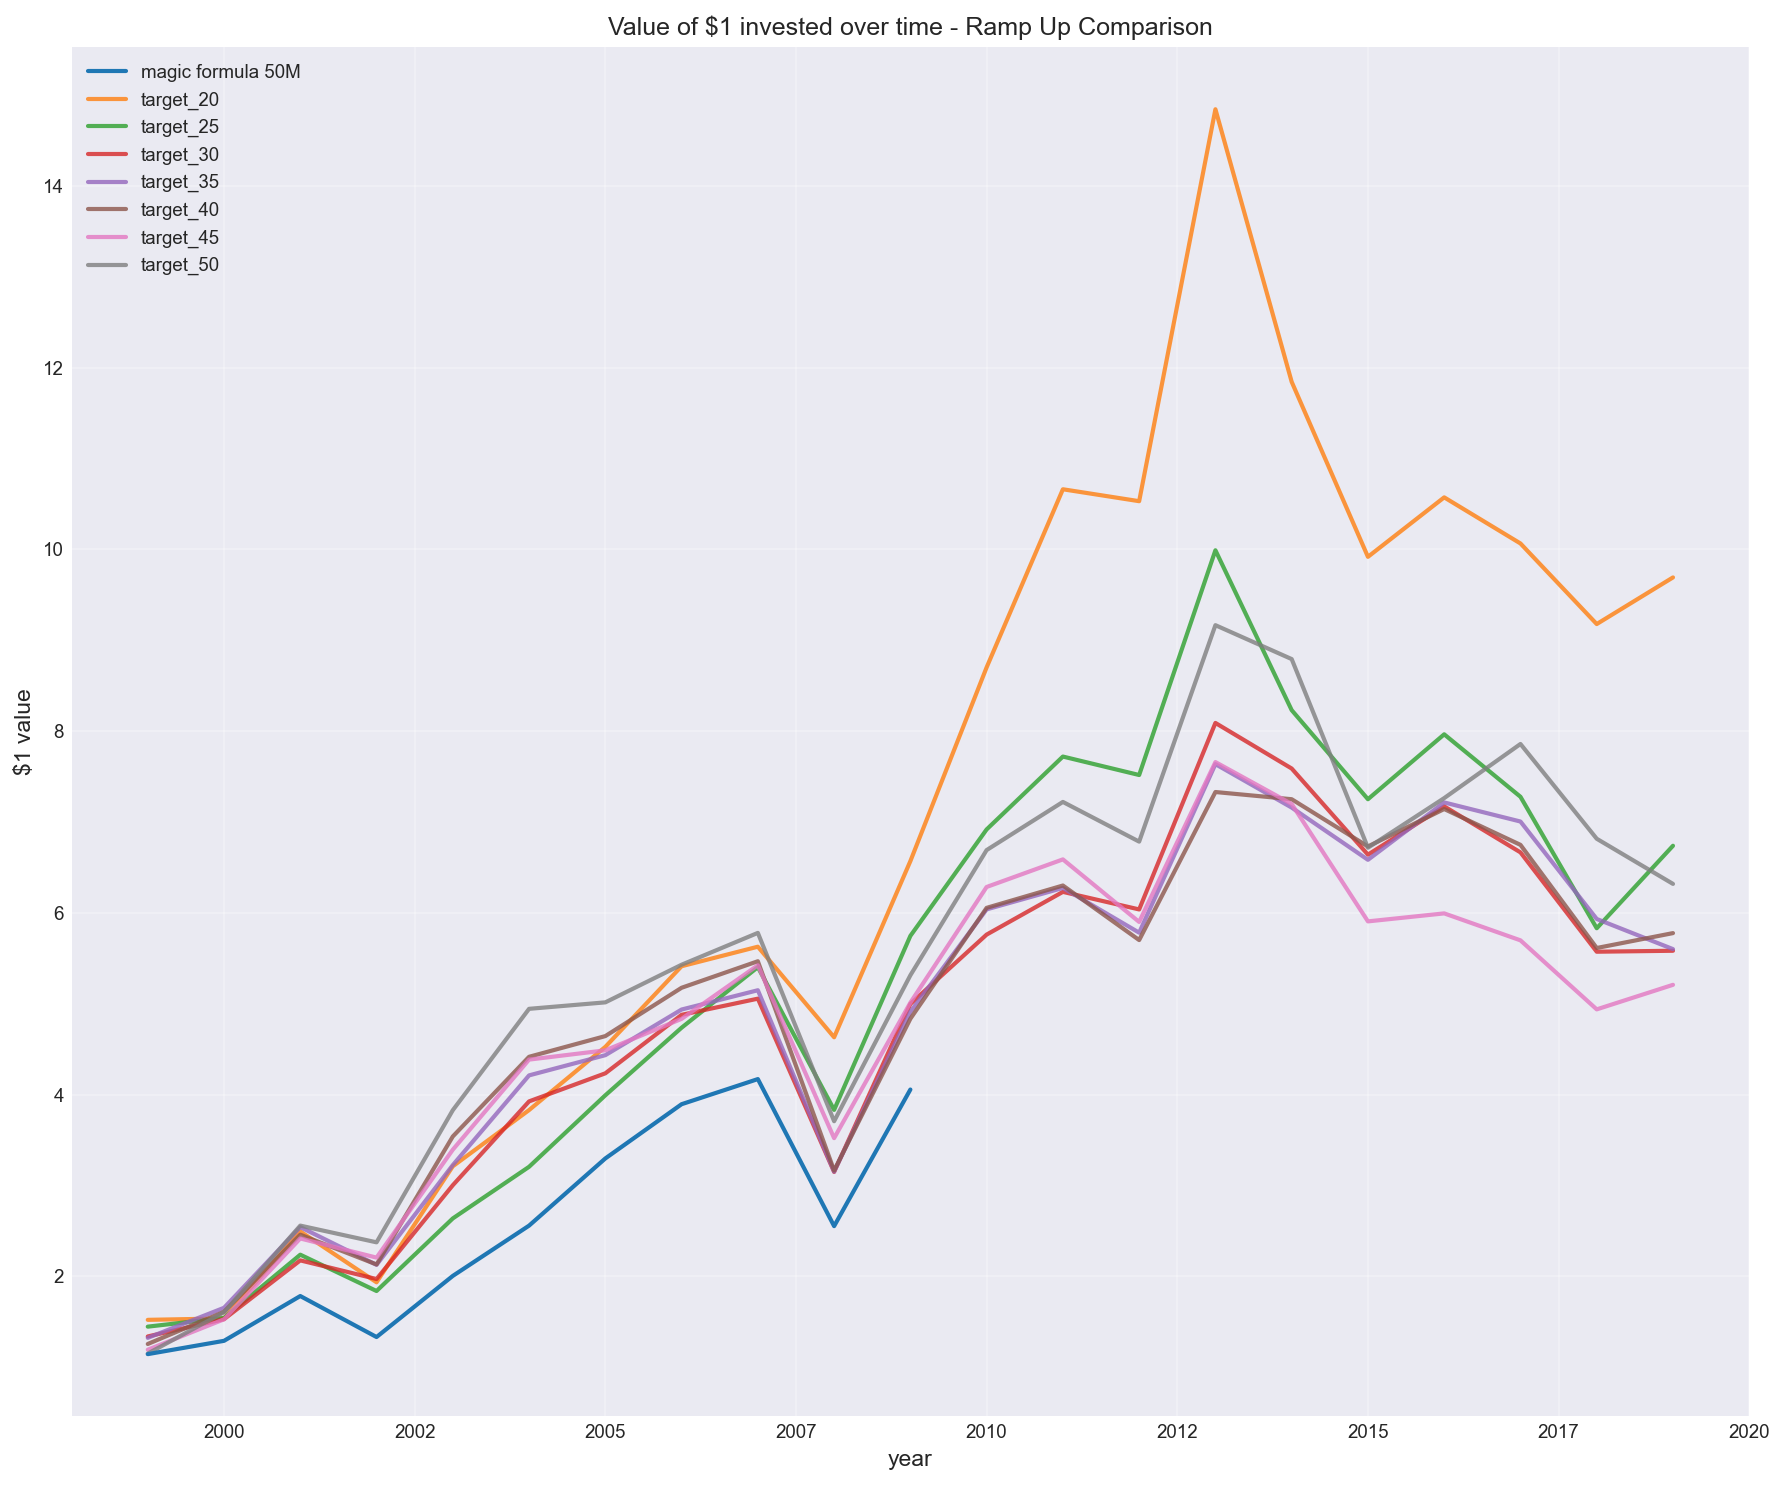
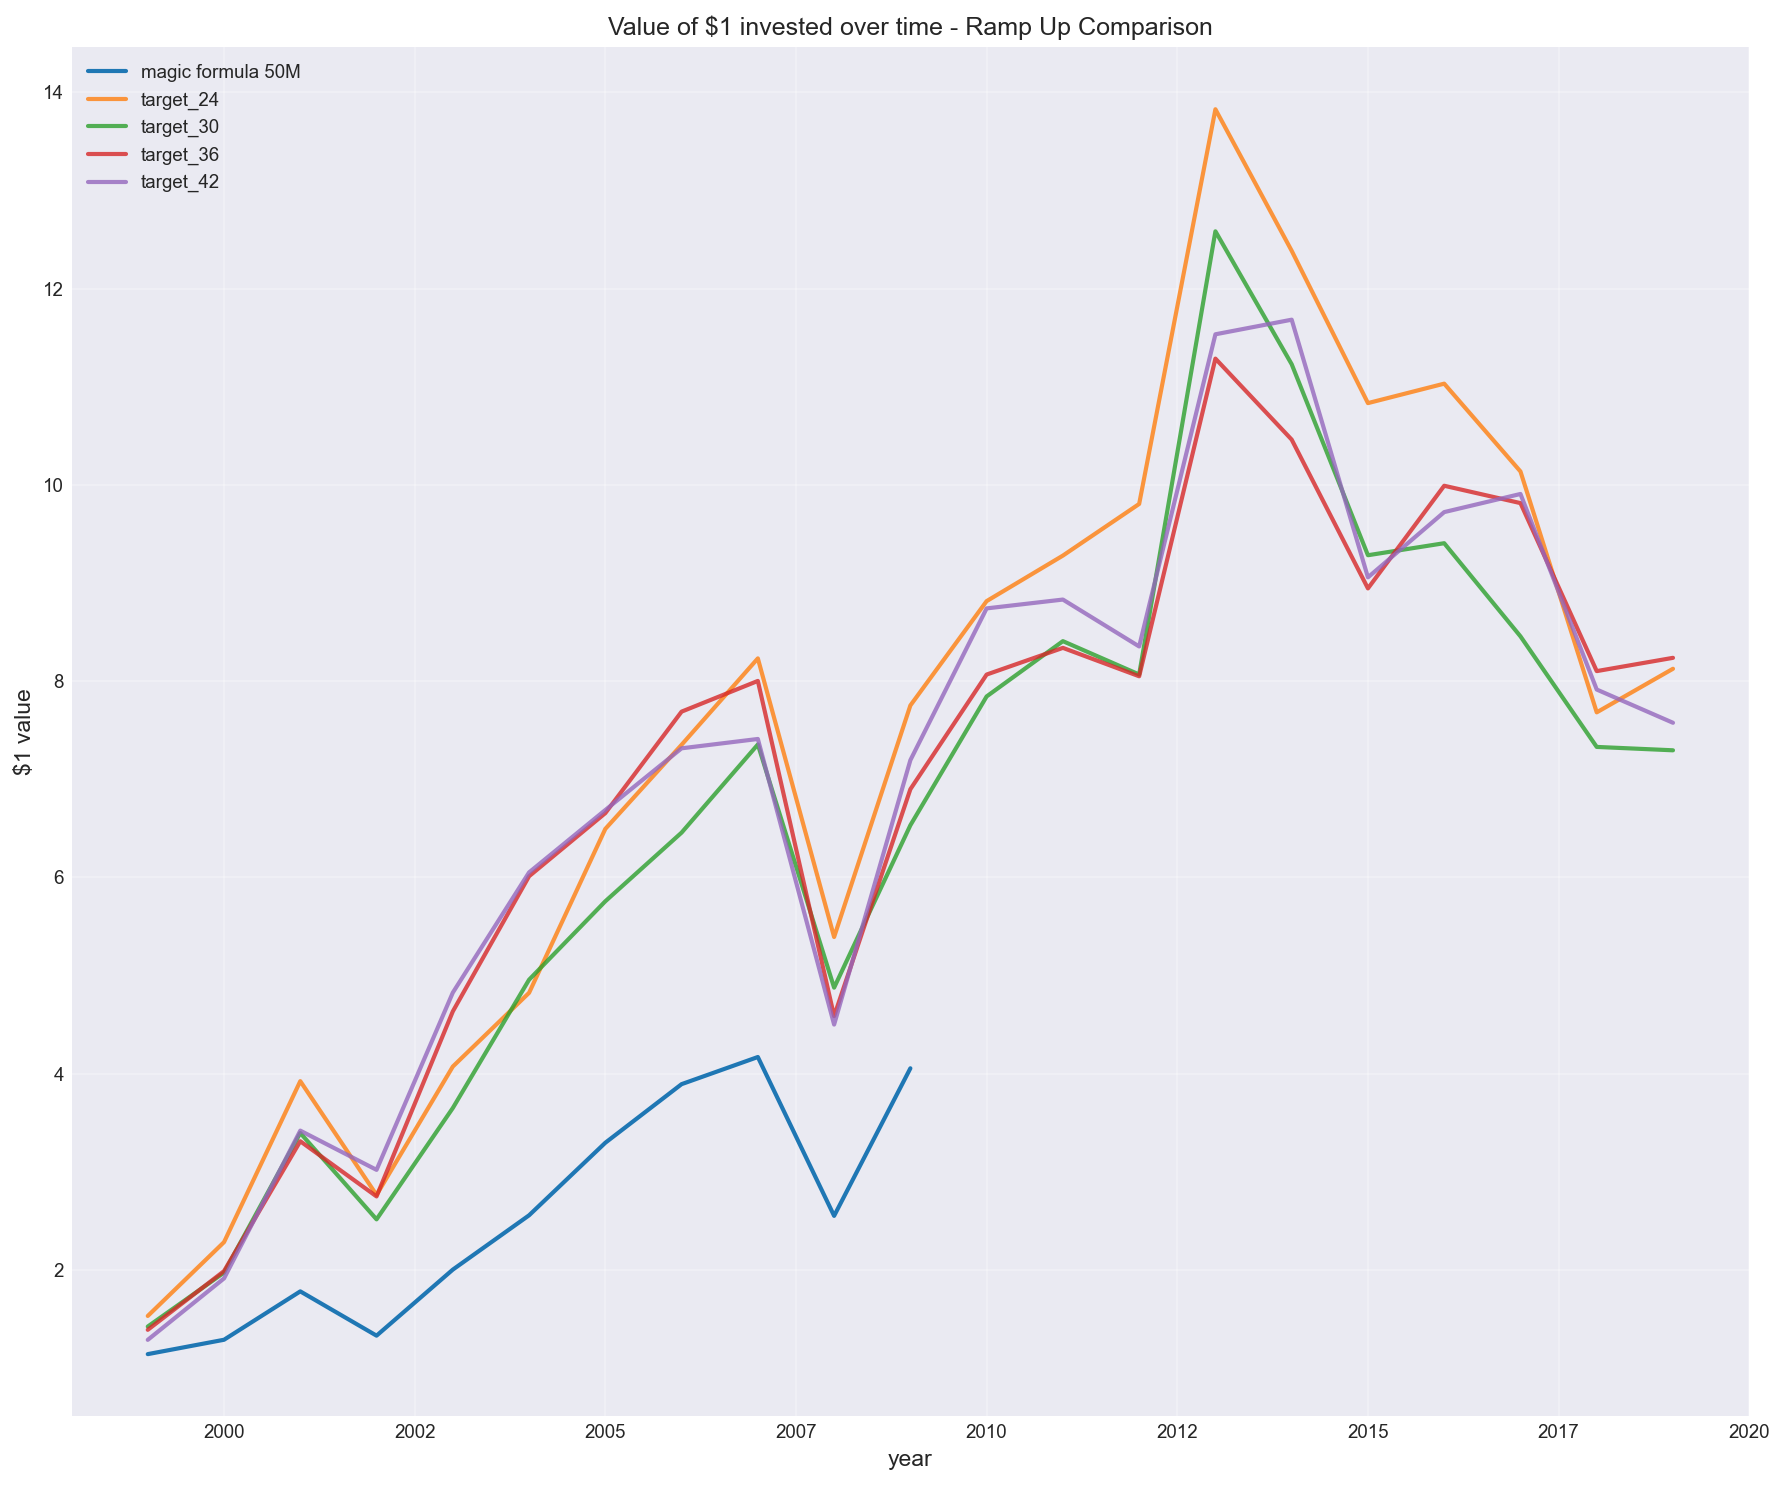
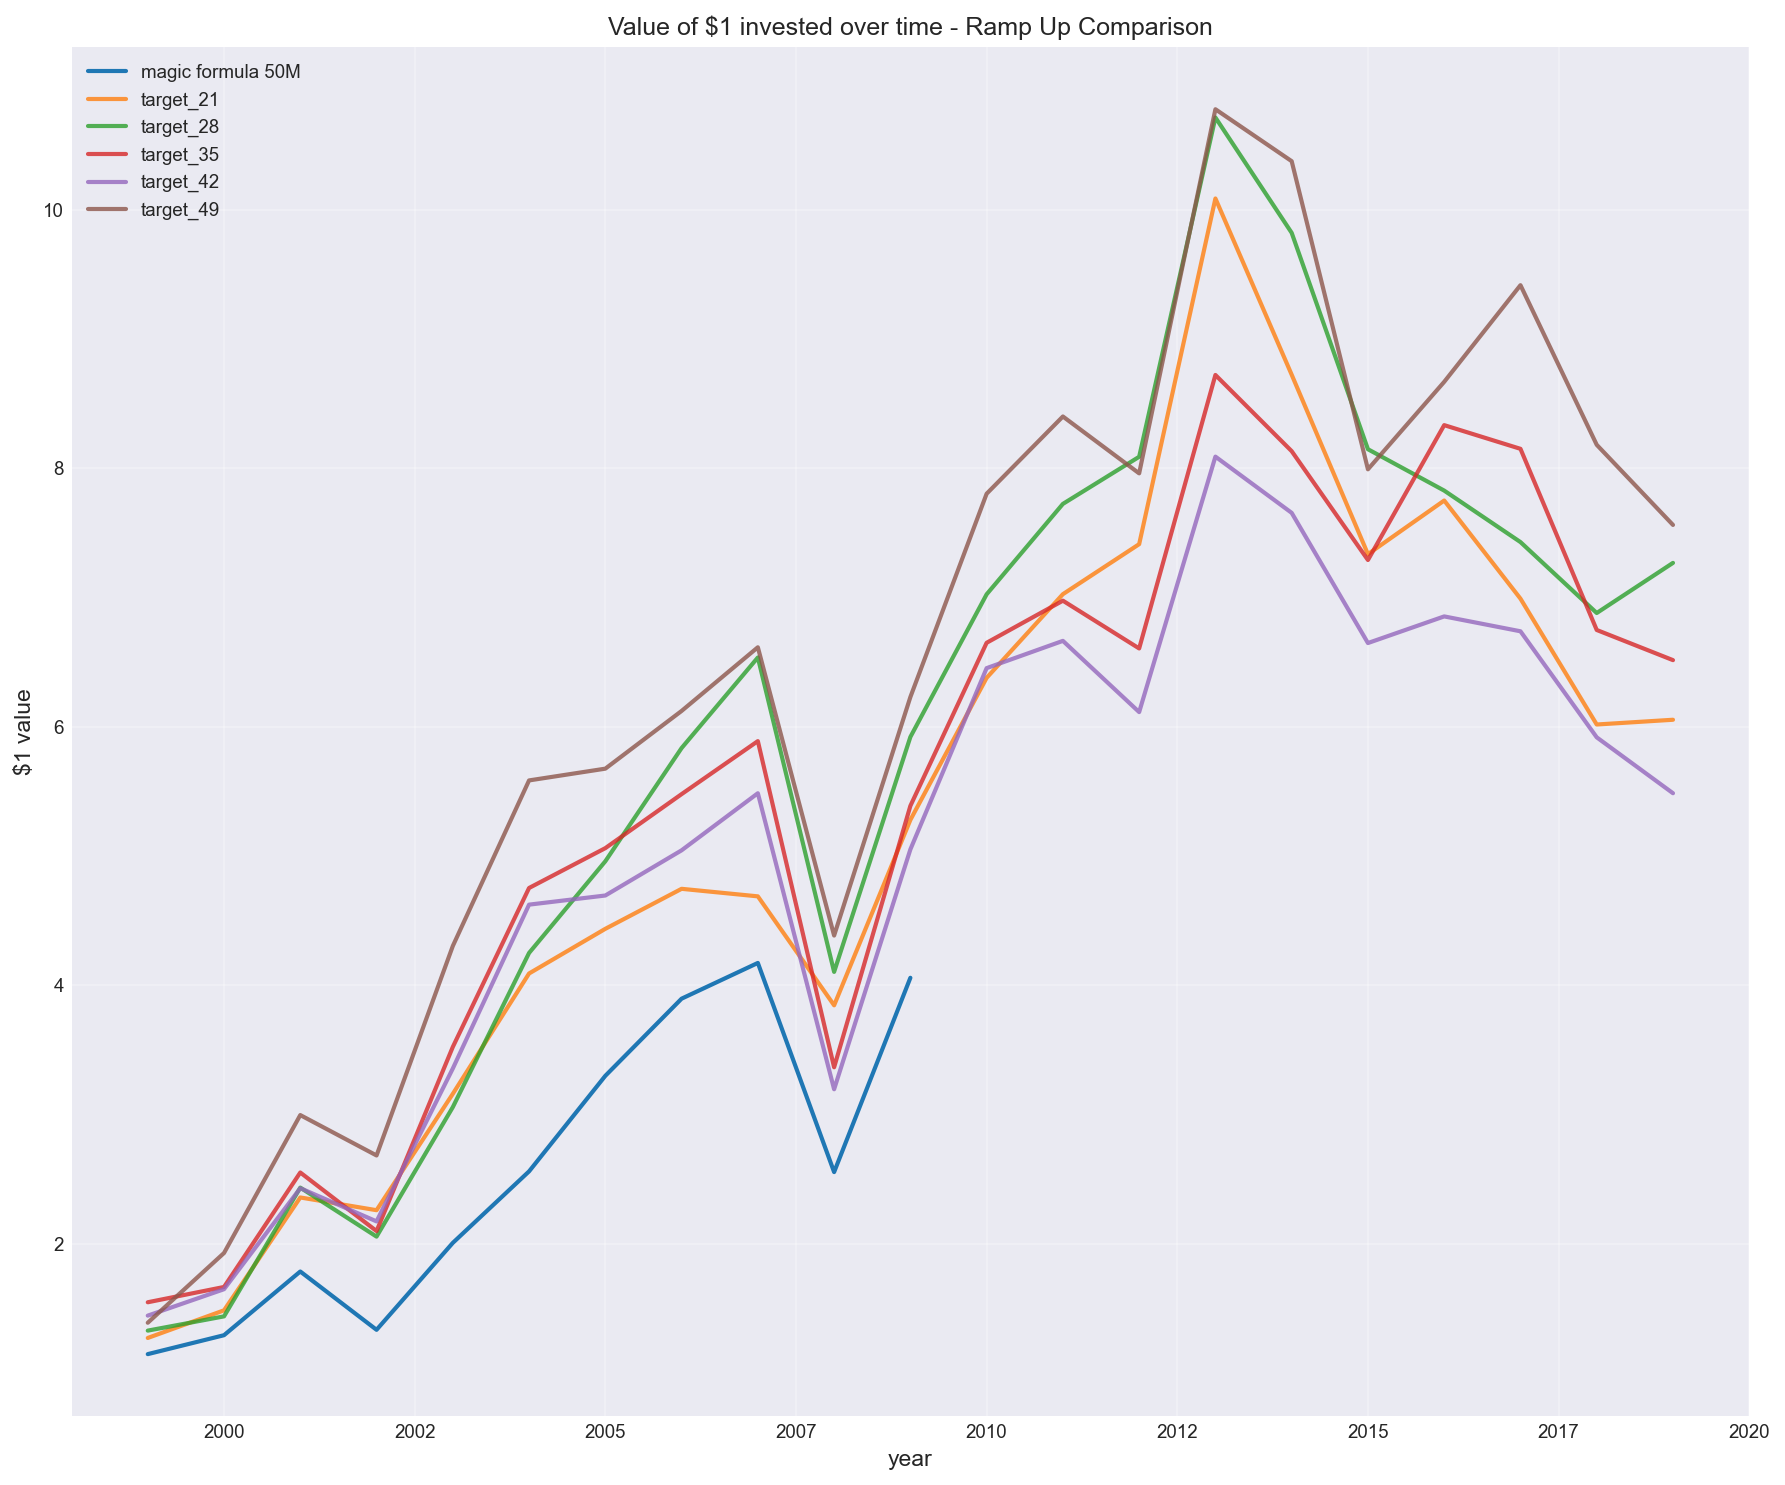
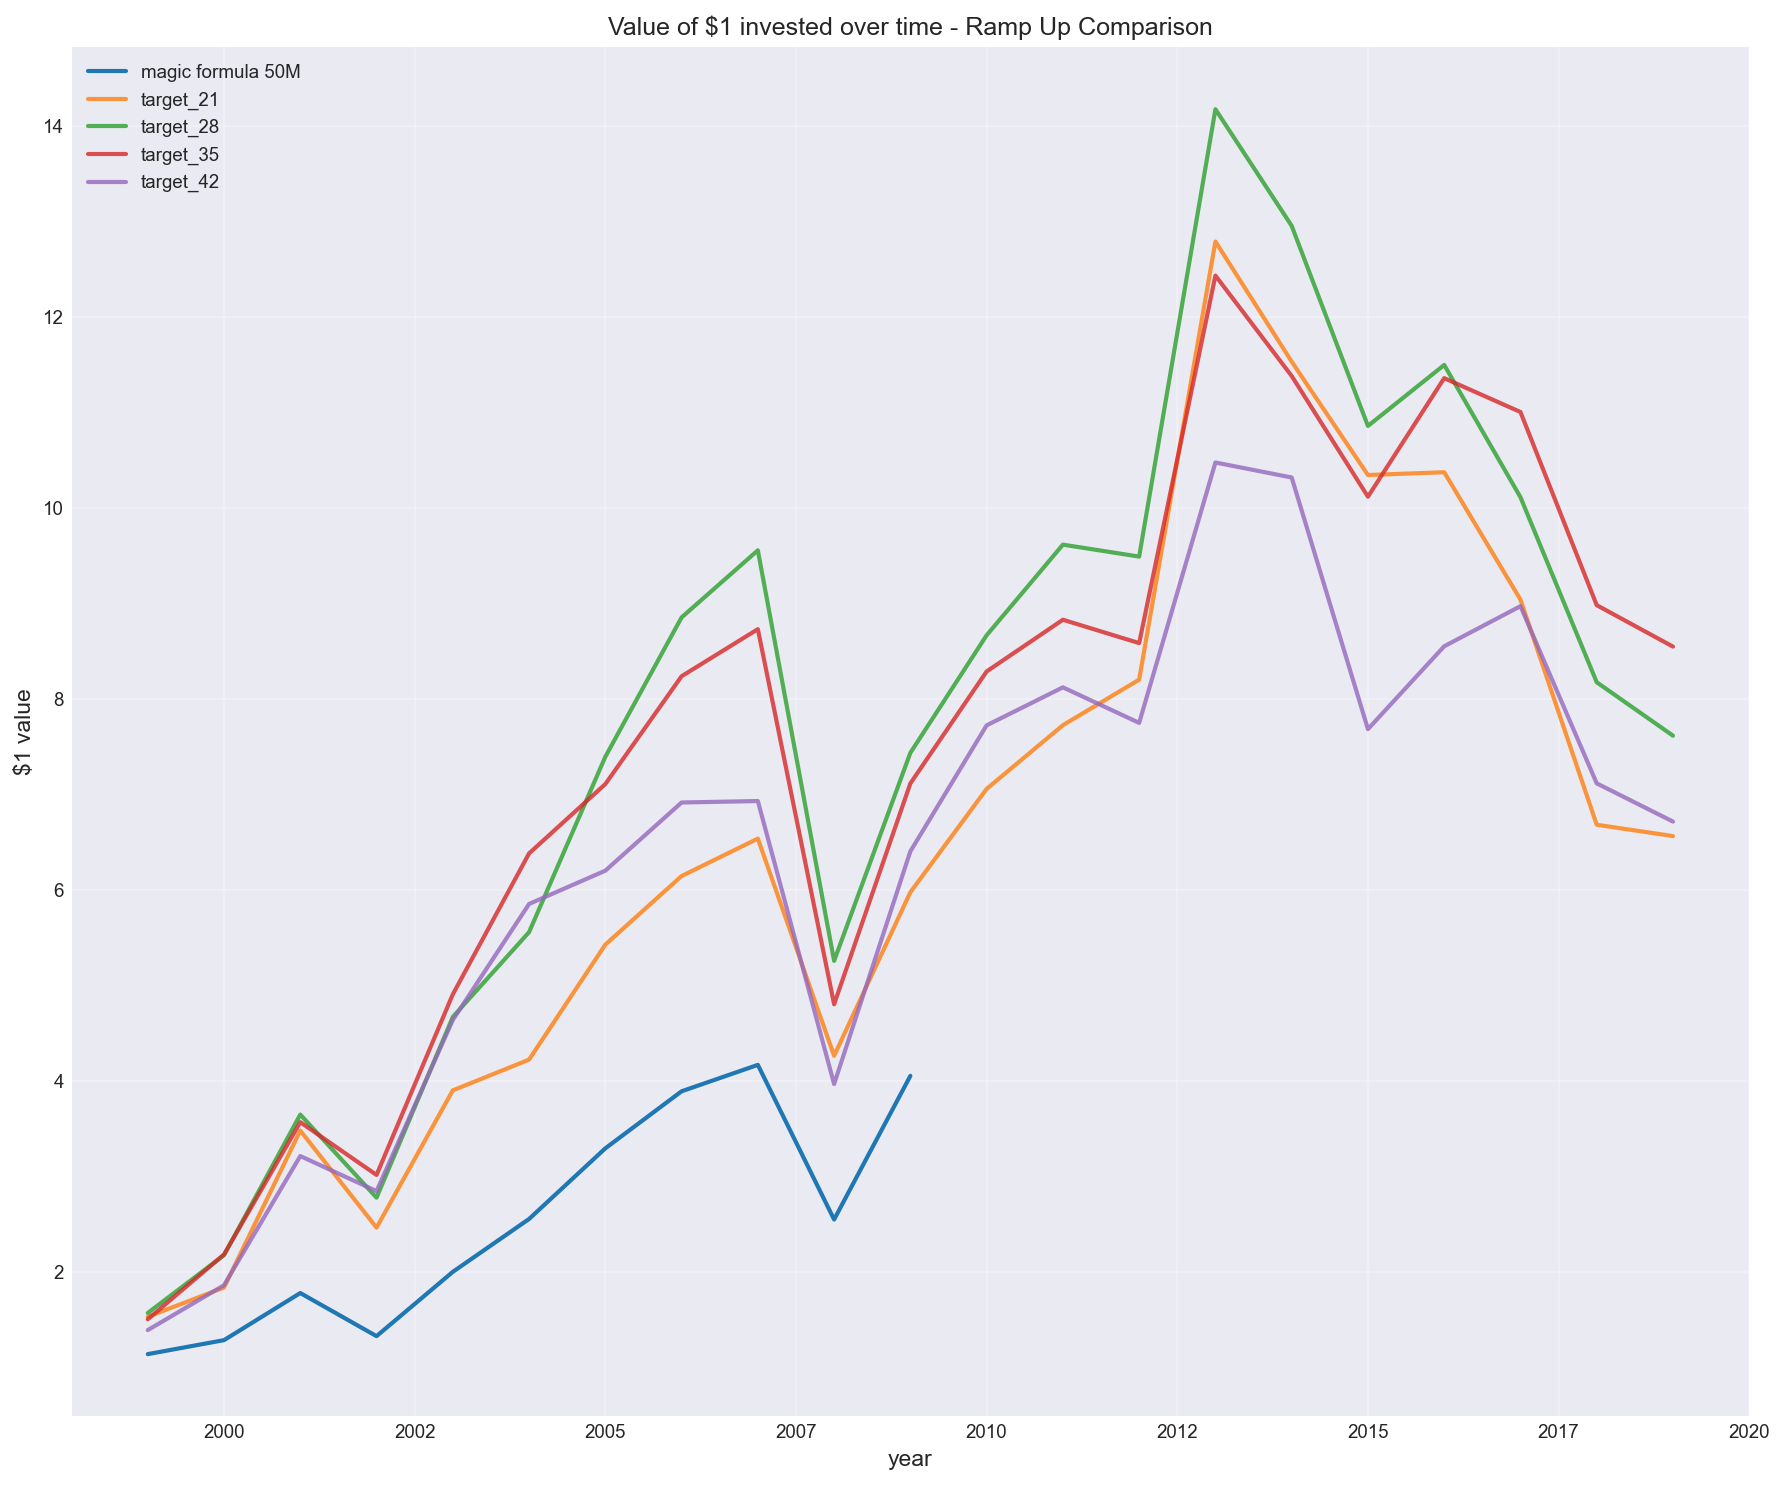
Similarly, see other configurations for buying stocks every 5, 6 or 7 months, and reaching different target portfolio sizes.
Buying 5 stocks every 3 months
Buying 6 stocks every 2 months

Buying 6 stocks every 3 months
Buying 7 stocks every 2 months
Buying 7 stocks every 3 months
2. Removing return on capital
I also tested a variation inspired by Tobias Carlisle (in Acquirer’s Multiple):
Remove return on capital and rank purely on earnings yield.
In my tests, this version:
- outperformed the traditional Magic Formula
- produced stronger results over the same period
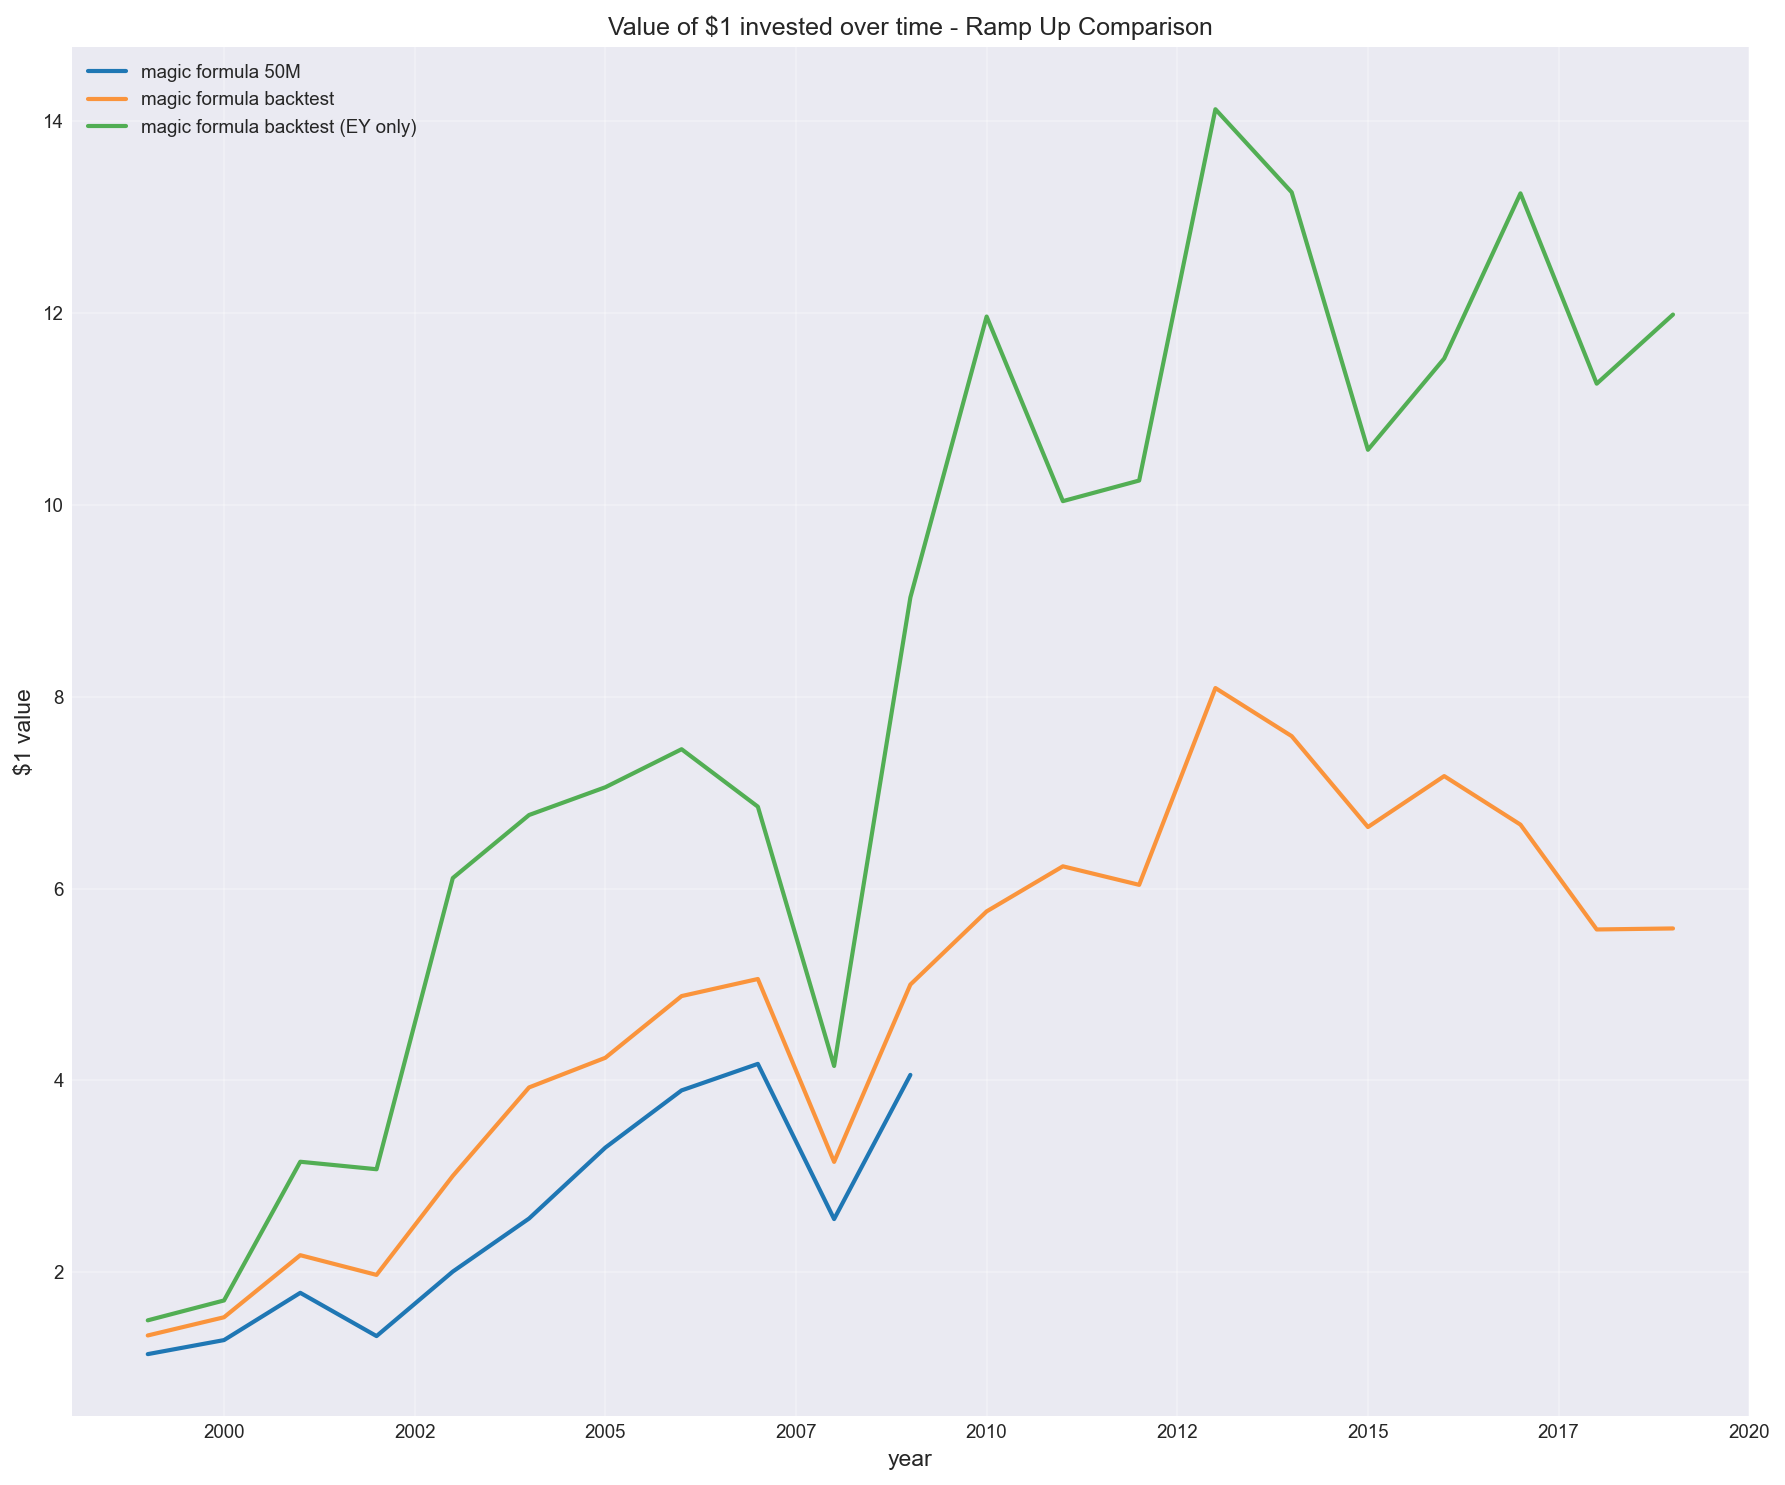
This aligns with the idea that:
- high-quality businesses attract capital and mean revert (i.e. amazing companies don’t tend to stay amazing forever and bad companies don’t tend to stay bad forever)
- cheapness (earnings yield) carries more of the return signal
But the key point is:
this wasn’t theory — it showed up in the data
3. Other variations
I also tested other variations of what can and can’t be removed. Making sure the (Python) code was config driven so it didn’t need a re-write of any of the logic, just simply add a different config and run to see the results:
Buying multiples of 6 stocks every 6 months
The below tests portfolio sizing, e.g. “ramp up 12 6 12” means buy 12 stocks every 6 months (until you reach portfolio size 12)”.
Other algorithm configurations.
Without printing copious plots other various backtests were performed which show similar variability in the outcomes. These relate to the following variables for example:
- Excluded tickers based on sic_sector, sic_industry codes
- Rules for low price-earnings or return-on-capital (showing spurious data points)
- Minimum market capitalization (above 50M)
- Rules for missing earnings-yield or return-on-capital columns
- Changing tax rates (based on time period and/or jurisdiction)
- Minimum ticker price
- How many days to force a sale before last price date
- Mode for winning stocks (if they are still ranked in the top)
- Keep winners after 1 year but do not increase position size (default)
- Increase winners after 1 year
- Drop winners after 1 year (even if in top rankings)
Costs, tax, and execution aren’t optional
The backtest also included:
- brokerage and slippage
- dividend flows
- tax on gains and losses
- monthly portfolio valuation
These had a non-trivial impact, especially with regular turnover.
A strategy that looks strong before costs can degrade quickly once realistic assumptions are applied.
And importantly:
US backtests don’t translate cleanly to other markets (e.g. Australia)
The main takeaway
The Magic Formula is not the insight.
The insight is what happens when you actually try to implement it.
- data timing matters
- filtering choices matter
- portfolio construction matters
- execution assumptions matter
- tax rules matter
- spurious data issues and rules to handle these matter
In my testing, these weren’t rounding errors.
In some cases, the spread between implementations was comparable to the entire excess return of the strategy.
Closing thought
It’s easy to read a strategy and assume the edge is in the idea.
In practice, the edge is often in:
- how the data is handled
- how the rules are applied
- and how the system behaves under real constraints (and assumptions)
That’s where data engineering and investing meet.
And that’s where most of the work actually is.


")